
注意
点击此处下载完整示例代码或通过Binder在浏览器中运行此示例
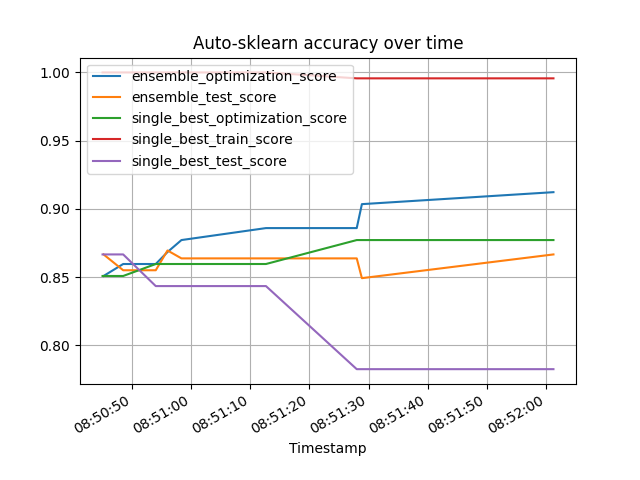
性能随时间变化图
此示例展示了如何使用 *performance_over_time_* 属性绘制训练过程中性能随时间变化的图。*performance_over_time_* 可以在 pandas 数据框中包含多个指标,具体为:
集成模型优化得分
集成模型测试得分
最佳单一模型优化得分
最佳单一模型测试得分
最佳单一模型训练得分
*auto-sklearn* 可以使用标签/序号编码器自动编码分类列。此示例重点介绍了如何正确设置 DataFrame 中的 dtype 以实现此目的,并展示了如何将测试数据输入到 autosklearn。
fit 函数的 X_train/y_train 参数将用于拟合 scikit-learn 模型,而 X_test/y_test 将用于评估此 scikit-learn 模型对未见数据(即不在 X_train/y_train 中的数据)的泛化能力。使用测试数据是衡量训练模型是否过拟合的一个好机制,更多详细信息可在评估估计器性能中找到。
为了提供 **_test_score* 指标,必须向 AutoML 模型提供 X_test 和 y_test,如本例所示。
此外,还支持通过 fit() 的 feat_types 参数手动指示特征类型(列是分类型还是数值型)。这在使用列表或 numpy 数组时非常重要,因为它们没有按列的 dtype(更多详细信息请参阅示例 特征类型)。
import time

import matplotlib.pyplot as plt
import numpy as np
import pandas as pd
import sklearn.model_selection
import sklearn.datasets
import sklearn.metrics

from smac.tae import StatusType

import autosklearn.classification
数据加载
# Using Australian dataset https://www.openml.org/d/40981.
# This example will use the command fetch_openml, which will
# download a properly formatted dataframe if you use as_frame=True.
# For demonstration purposes, we will download a numpy array using
# as_frame=False, and manually creating the pandas DataFrame
X, y = sklearn.datasets.fetch_openml(data_id=40981, return_X_y=True, as_frame=False)

# bool and category will be automatically encoded.
# Targets for classification are also automatically encoded
# If using fetch_openml, data is already properly encoded, below
# is an example for user reference
X = pd.DataFrame(data=X, columns=["A" + str(i) for i in range(1, 15)])
desired_boolean_columns = ["A1"]
desired_categorical_columns = ["A4", "A5", "A6", "A8", "A9", "A11", "A12"]
desired_numerical_columns = ["A2", "A3", "A7", "A10", "A13", "A14"]
for column in X.columns:
    if column in desired_boolean_columns:
        X[column] = X[column].astype("bool")
    elif column in desired_categorical_columns:
        X[column] = X[column].astype("category")
    else:
        X[column] = pd.to_numeric(X[column])

y = pd.DataFrame(y, dtype="category")

X_train, X_test, y_train, y_test = sklearn.model_selection.train_test_split(
    X, y, test_size=0.5, random_state=3
)
print(X.dtypes)
A1         bool
A2      float64
A3      float64
A4     category
A5     category
A6     category
A7      float64
A8     category
A9     category
A10     float64
A11    category
A12    category
A13     float64
A14     float64
dtype: object
构建并拟合分类器
cls = autosklearn.classification.AutoSklearnClassifier(
    time_left_for_this_task=120,
    per_run_time_limit=30,
)
cls.fit(X_train, y_train, X_test, y_test)
AutoSklearnClassifier(ensemble_class=<class 'autosklearn.ensembles.ensemble_selection.EnsembleSelection'>,
                      per_run_time_limit=30, time_left_for_this_task=120)
获取最终集成模型的得分
predictions = cls.predict(X_test)
print("Accuracy score", sklearn.metrics.accuracy_score(y_test, predictions))
Accuracy score 0.8666666666666667
绘制集成模型性能图
*performance_over_time_* 属性返回一个 pandas 数据框,可以直接用于绘图
poT = cls.performance_over_time_
poT.plot(
    x="Timestamp",
    kind="line",
    legend=True,
    title="Auto-sklearn accuracy over time",
    grid=True,
)
plt.show()
脚本总运行时间: ( 2 分钟 2.445 秒)